Blackjack Analytics Pipeline
An end-to-end AWS + PySpark big-data pipeline analyzing 900K blackjack hands, ingestion on S3, Spark processing on EC2, SageMaker models, and a Power BI dashboard.
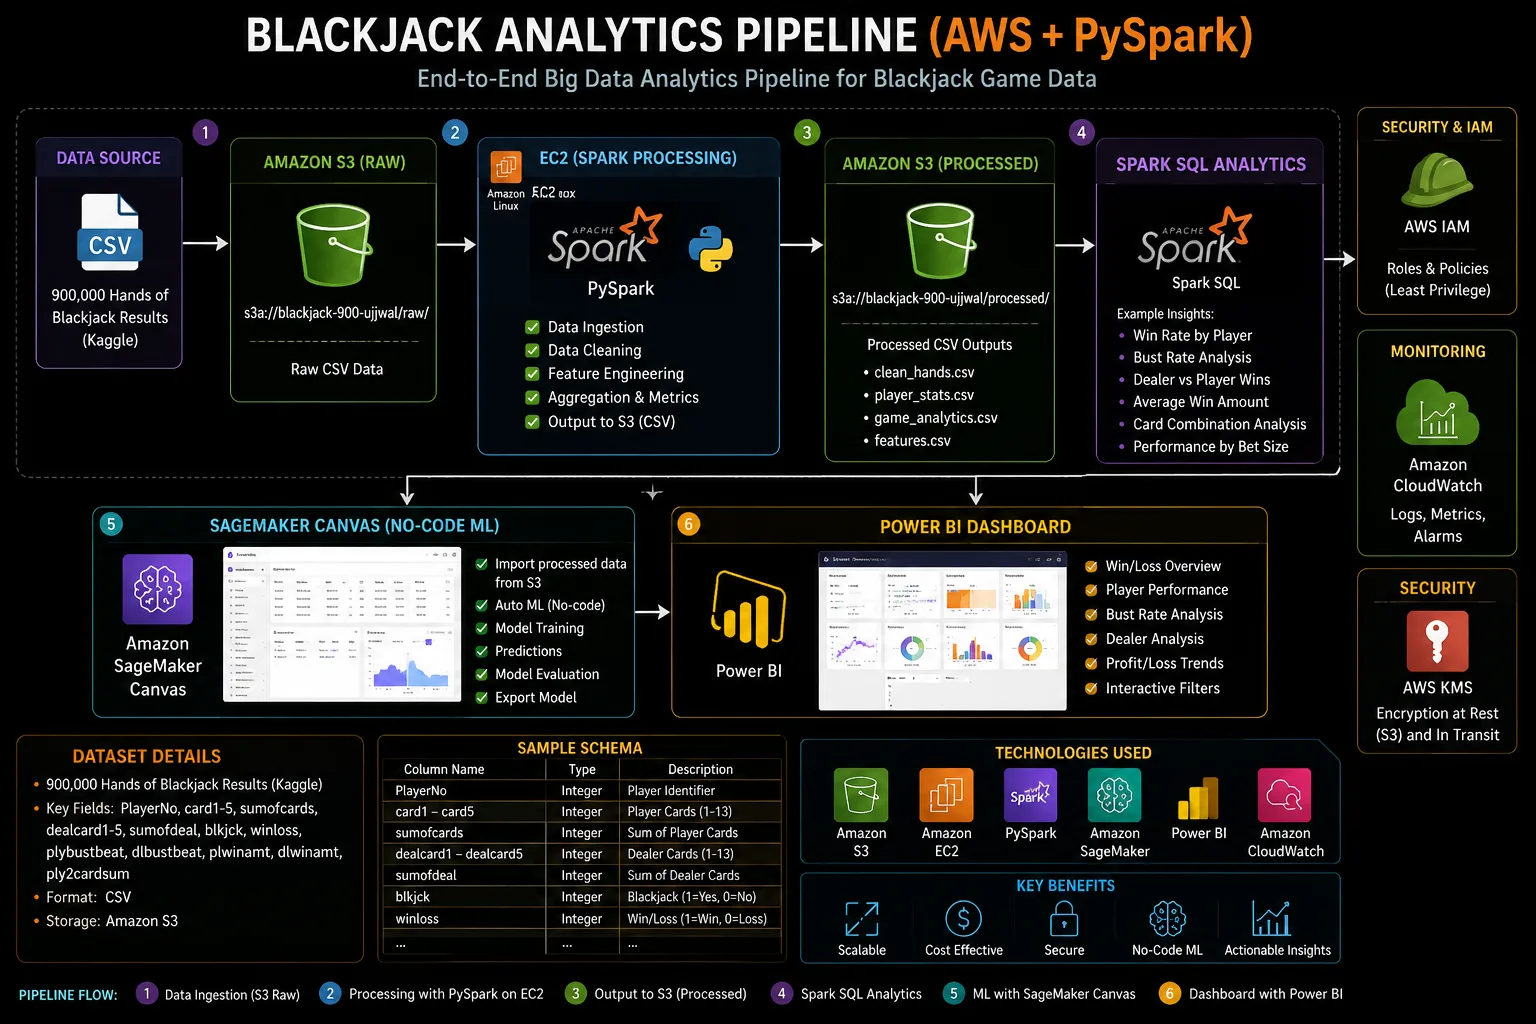
A production-style cloud analytics pipeline, end to end.
The project ingests, processes, analyzes, and stores a 900,000-hand blackjack dataset for downstream analytics, ML, and dashboards, using AWS managed services rather than a single local script.
S3 → EC2 PySpark → Spark SQL → SageMaker → Power BI.
Raw hands land in S3; PySpark on EC2 cleans the data and engineers features (player/dealer cards drawn); Spark SQL runs the analytics; SageMaker Canvas handles no-code model training; and Power BI visualizes the processed dataset. Outputs are written back to S3 in a `raw/` and `processed/` structure.
Quantified game insights.
The analysis surfaced concrete statistics, a 42.88% player win rate, 47.76% dealer win rate, 4.78% blackjack frequency, and bust rates of 17.87% (player) and 28.11% (dealer), alongside top-player and win-pattern breakdowns.